R: Scatterplots, Symbols, and Lines
Scatterplots
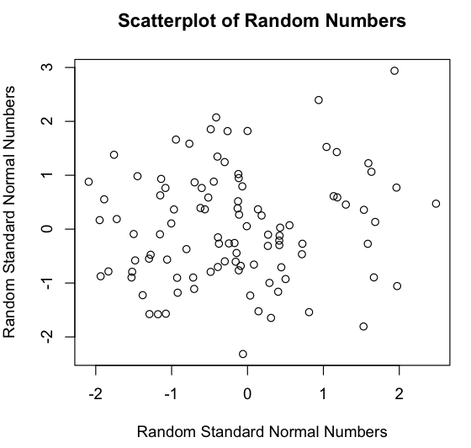 |
x=rnorm(100) ### Create 100 random standard normal numbers
y=rnorm(100) ### Create 100 random standard normal numbers ### Create a simple scatterplot with titles plot(x, y, main="Scatterplot of Random Numbers", xlab="Random Standard Normal Numbers", ylab="Random Standard Normal Numbers") |
Symbols
 |
Use pch to define the symbol
#### Examples
x=rnorm(100) y=rnorm(100) plot(x, y, pch=8) |
Reference: http://rgraphics.limnology.wisc.edu/pch.php
Lines
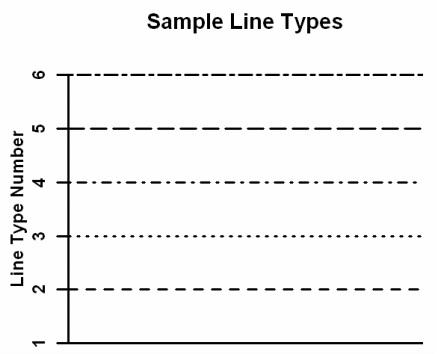 |
Use lty to define the line type
#### Example
x=rnorm(100) ### Create 100 random standard normal numbers, assign to variable x y=rnorm(100) ### Create 100 random standard normal numbers, assign to variable y plot(x, y, pch=25) ### Create a simple scatterplot model=lm(y~x) ### least-squares regression line abline(model, lty=4) ### overlay the scatterplot of the least-squares regression line using the function abline, then define line type using lty |
Line Types (p, l, o, b)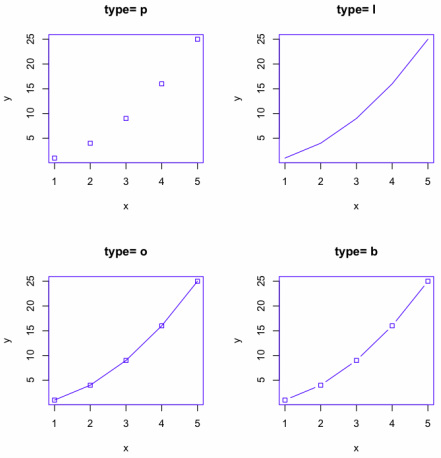 |
Use type to define the line typex <- c(1:5); y <- x^2 # create some data
par(pch=22, col="blue") # plotting symbol and color par(mfrow=c(2,2)) # all plots on one page opts = c("p","l","o","b") for(i in 1:length(opts)){ heading = paste("type = ",opts[i]) plot(x, y, , main=heading) lines(x, y, type=opts[i]) } # |
REFERENCE: http://dionysus.psych.wisc.edu/Wiki/index.php?title=Line_Types_in_R
