R: Boxplots
Code Only
|
Code With Rweb Output
|
|
### Examples using the pre-installed airquality dataset found in R
head(airquality) ###displays the first few observations for each variable names(airquality) ### View the variable names attach(airquality) ### Attach command allows us ### to call the variables directly ### Boxplot A boxplot(Wind) ### Default, vertical boxplot ### Boxplot B ### Create a horizontal boxplot boxplot(Wind, horizontal=TRUE, col="blue") ### Boxplot C boxplot(Temp~Month, # Create boxplots for Temp against Month col=rainbow(12), # Add a little color :) main="Boxplot of Temperature by Month", ### Give the graph a main title xlab="Month", ### Give the graph an x-axis label ylab="Temperature (F)") ### Give the graph a y-axis label |
> ### Examples using the pre-installed airquality dataset found in R
> head(airquality) ###displays the first few observations for each variable Ozone Solar.R Wind Temp Month Day 1 41 190 7.4 67 5 1 2 36 118 8.0 72 5 2 3 12 149 12.6 74 5 3 4 18 313 11.5 62 5 4 5 NA NA 14.3 56 5 5 6 28 NA 14.9 66 5 6 > names(airquality) ### View the variable names [1] "Ozone" "Solar.R" "Wind" "Temp" "Month" "Day" > attach(airquality) ### Attach command allows us > ### to call the variables directly > ### Boxplot A > boxplot(Wind) ### Default, vertical boxplot 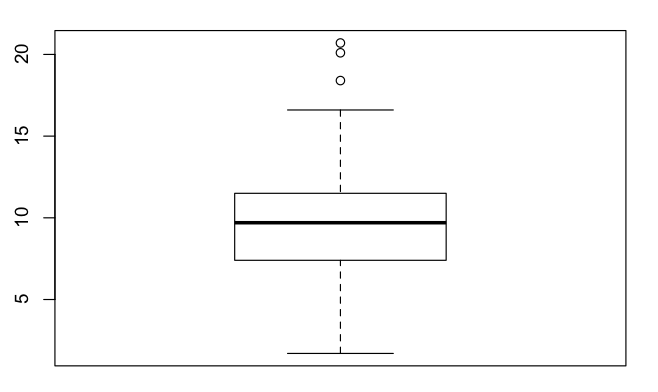 ### Boxplot B
> boxplot(Wind, horizontal=TRUE, col="blue") ### Create a horizontal boxplot 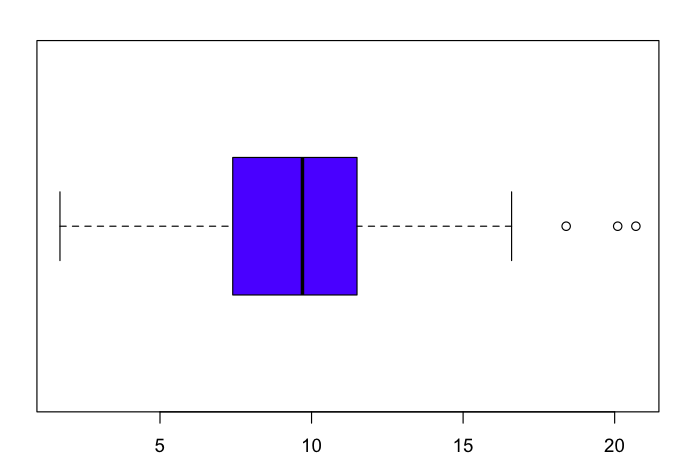 ### Boxplot C > boxplot(Temp~Month, ### Create boxplots for Temp against Month + col=rainbow(12), ### Add a little color :) + main="Boxplot of Temperature by Month", ### Give the graph a main title + xlab="Month", #### Give the graph an x-axis label + ylab="Temperature (F)") #### Give the graph a y-axis label 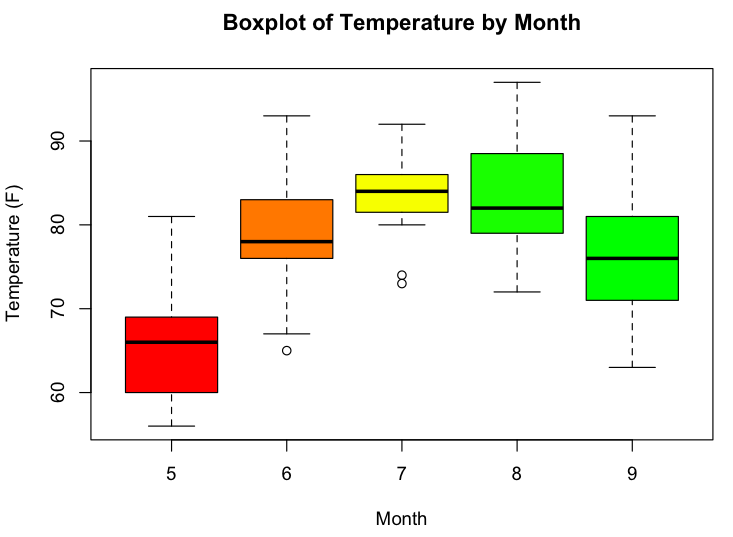 |

This work is licensed under a Creative Commons Attribution-NonCommercial-ShareAlike 3.0 Unported License.
