R: Histograms and Density Plots
1. Creating a Simple Histogram
|
R CODE
## Create 100 random standard normal numbers |
R OUTPUT
> ## Create 100 random standard normal numbers 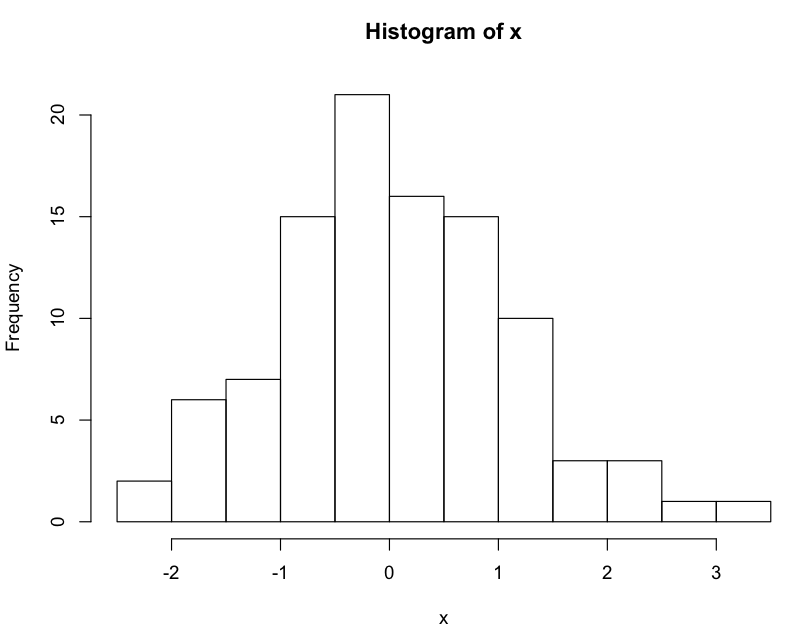
|
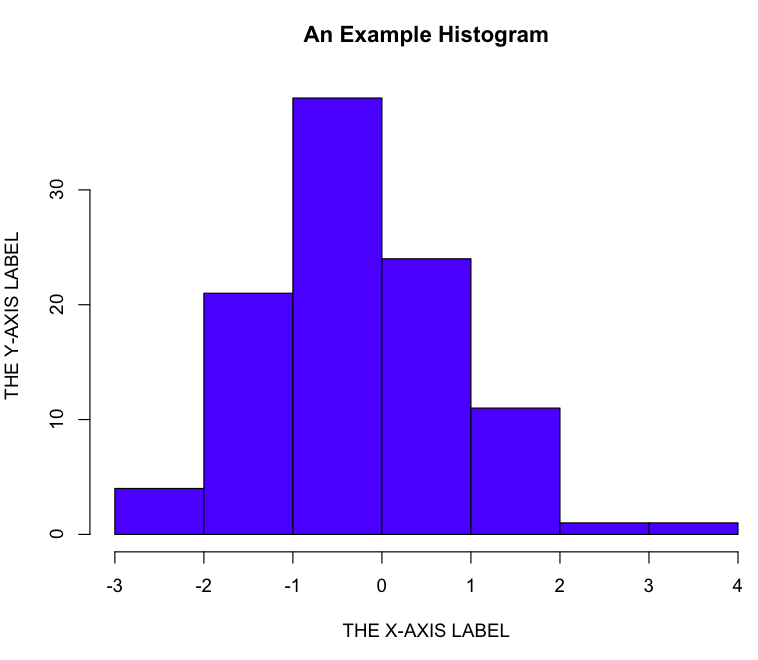
2. Create a Histogram With Color and Labeled Axis
Example 1
|
R CODE
## Create 100 random standard normal numbers |
R OUTPUT
|
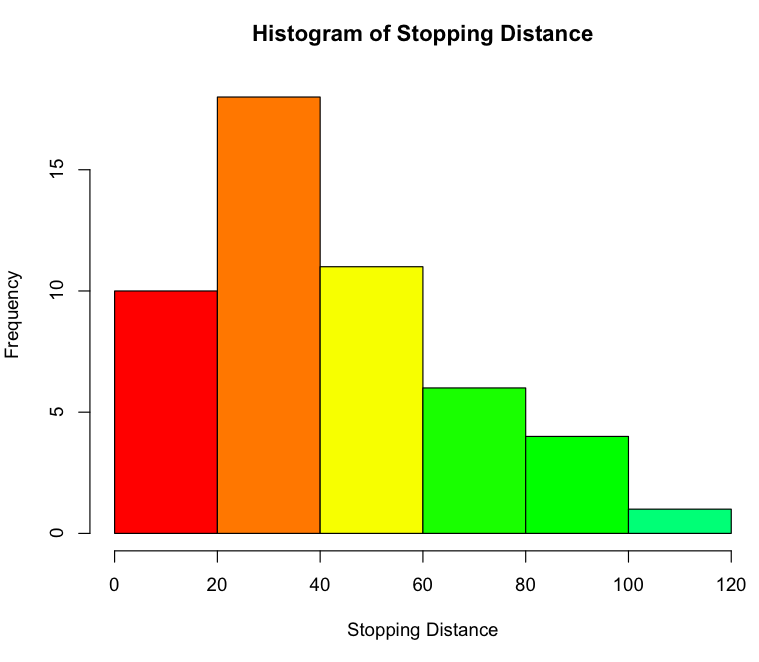
Example 2
|
R CODE
##### Using the cars data set pre-installed in R |
R OUTPUT
|
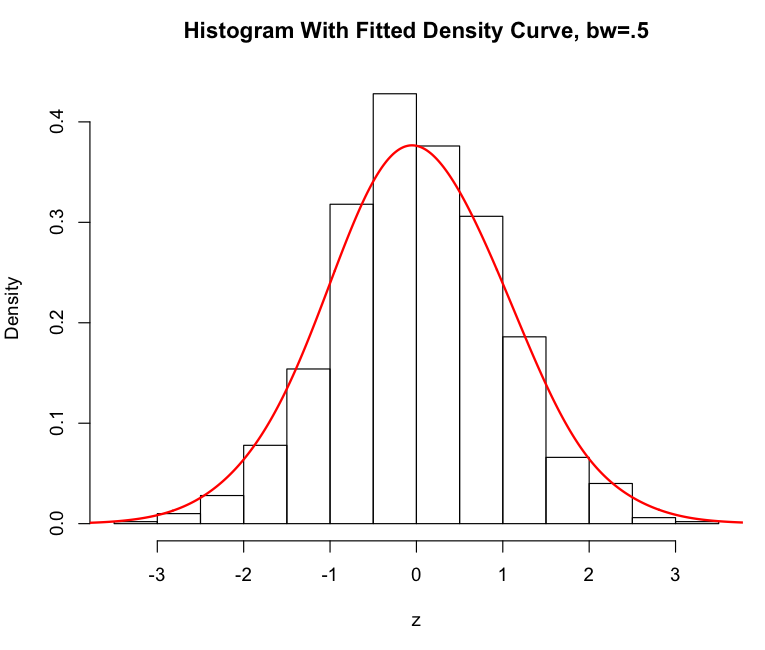
3. Histogram with Fitted Density Curve
|
R CODE
z=rnorm(1000) |
R OUTPUT
|
