R: Linear Regression
A. Enter the dataset into R/Rweb.
B. Create a properly labeled scatterplot of the dataset. C. Have R/Rweb determine the equation for the least squares regression line as well as the correlation between the two variables. D. Fit the least squares regression line to the scatterplot. |
Data Set
|

|
R Code
stretch=c(46, 54, 48, 50, 44, 42, 52) |
R Output
> stretch=c(46, 54, 48, 50, 44, 42, 52) |
B. Once we have the data in R/Rweb, we can then use the plot() function to create a simple scatterplot. For demonstration purposes, we will create two scatterplots, one with no labels, and another one that has a main title, x-axis and y-axis labels.
NOTE: When using the plot function, you want to use the following structure:
plot(your.x.variable.name, y.variable.name, main="Main Title, xlab="x axis label", ylab="y-axis label")
NOTE: When using the plot function, you want to use the following structure:
plot(your.x.variable.name, y.variable.name, main="Main Title, xlab="x axis label", ylab="y-axis label")
|
R Code
plot(stretch, distance) ### with no labels |
R Output
> plot(stretch, distance) ### with no labels 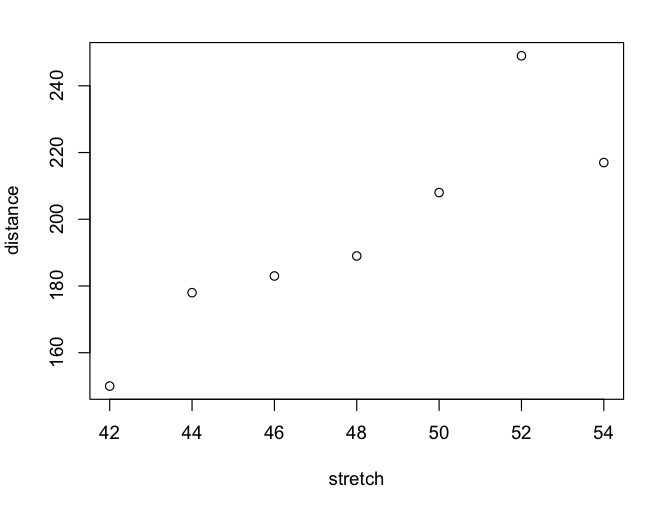
> plot(stretch, distance, 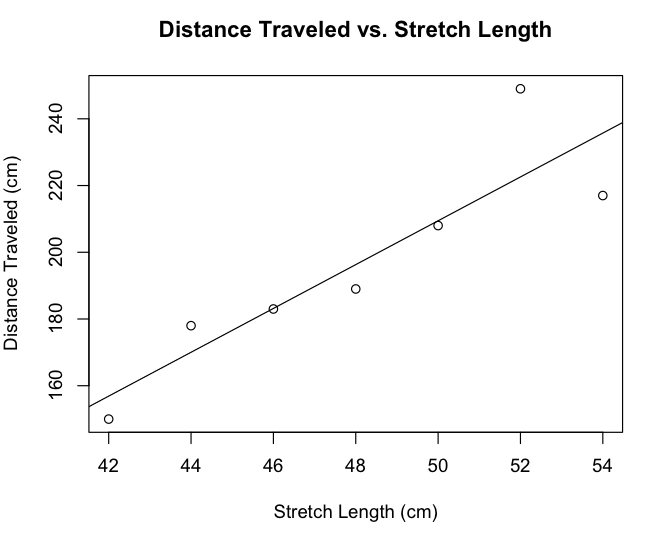
|
C. Using the lm() function, which stands for linear model, we can now have R/Rweb determine the equation for the least squares regression line as well as the correlation between the two variables using the cor() function.
NOTE: When using the lm function, you want to use the following structure:
model=lm(y.variable.name~x.variable.name)
NOTE: When using the lm function, you want to use the following structure:
model=lm(y.variable.name~x.variable.name)
|
R Code
## Least squares regression info stored in modelmodel=lm(distance~stretch) |
R Output
> ## Least squares regression info stored in model |
Coefficients:
(Intercept) stretch -119.143 6.571 Answer: The output indicates that y-hat has the following formula: 
|

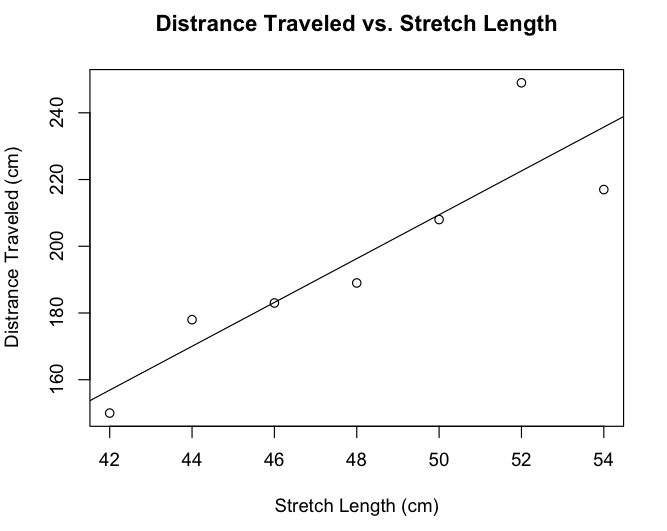
D. Once you have the scatterplot created (part B), use the abline() function to fit the least-squares regression line to your scatterplot.
|
R Code
### the abline() function will add the least-squares regression line to your ### scatterplot |
R Output
|
