R: Cumulative Frequency Graph
Code Only
|
Code with Rweb Output
|
|
### We are going to use the cars data set for analysis
attach(cars) names(cars) ### set speed as the variable we wish to analyze data = speed ### find the max and min for our data max.data=max(data) min.data=min(data) ### using the max and min, slice our data into 20 sections slice=round((max.data-min.data)/20) breaks=seq(min.data, max.data, by=slice) ### Assign each point into their appropriate section cut.data=cut(data, breaks, right=FALSE) cut.data ### Create a table to count the frequency by section frequency=table(cut.data) frequency ### Add up the frequencies in the table cummul.freq=cumsum(frequency) cummul.freq ### Calculate the Relative Frequency relative.frequency=frequency/sum(frequency) cf=as.data.frame(cummul.freq) cf cummul.freq=cf[,1] cummul.freq cummul.percentile=cummul.freq/max(cummul.freq) cbind(frequency,relative.frequency,cummul.freq, cummul.percentile) graph.cummul.perc =c(0, cummul.percentile) plot(breaks, graph.cummul.perc, ylab="Relative Cumulative Frequency", main="Relative Cumulative Frequency Graph") lines(breaks, graph.cummul.perc) |
> ### We are going to use the cars data set for analysis
> attach(cars) The following object(s) are masked from 'cars (position 3)': dist, speed > names(cars) [1] "speed" "dist" > > ### set speed as the variable we wish to analyze > data = speed > > ### find the max and min for our data > max.data=max(data) > min.data=min(data) > > ### using the max and min, slice our data into 20 sections > slice=round((max.data-min.data)/20) > breaks=seq(min.data, max.data, by=slice) > > ### Assign each point into their appropriate section > cut.data=cut(data, breaks, right=FALSE) > cut.data [1] [4,5) [4,5) [7,8) [7,8) [8,9) [9,10) [10,11) [8] [10,11) [10,11) [11,12) [11,12) [12,13) [12,13) [12,13) [15] [12,13) [13,14) [13,14) [13,14) [13,14) [14,15) [14,15) [22] [14,15) [14,15) [15,16) [15,16) [15,16) [16,17) [16,17) [29] [17,18) [17,18) [17,18) [18,19) [18,19) [18,19) [18,19) [36] [19,20) [19,20) [19,20) [20,21) [20,21) [20,21) [20,21) [43] [20,21) [22,23) [23,24) [24,25) [24,25) [24,25) [24,25) [50] <NA> 21 Levels: [4,5) [5,6) [6,7) [7,8) [8,9) [9,10) ... [24,25) > > ### Create a table to count the frequency by section > frequency=table(cut.data) > frequency cut.data [4,5) [5,6) [6,7) [7,8) [8,9) [9,10) [10,11) 2 0 0 2 1 1 3 [11,12) [12,13) [13,14) [14,15) [15,16) [16,17) [17,18) 2 4 4 4 3 2 3 [18,19) [19,20) [20,21) [21,22) [22,23) [23,24) [24,25) 4 3 5 0 1 1 4 > > ### Add up the frequencies in the table > cummul.freq=cumsum(frequency) > cummul.freq [4,5) [5,6) [6,7) [7,8) [8,9) [9,10) [10,11) 2 2 2 4 5 6 9 [11,12) [12,13) [13,14) [14,15) [15,16) [16,17) [17,18) 11 15 19 23 26 28 31 [18,19) [19,20) [20,21) [21,22) [22,23) [23,24) [24,25) 35 38 43 43 44 45 49 > ### Calculate the Relative Frequency > relative.frequency=frequency/sum(frequency) > > cf=as.data.frame(cummul.freq) > cf cummul.freq [4,5) 2 [5,6) 2 [6,7) 2 [7,8) 4 [8,9) 5 [9,10) 6 [10,11) 9 [11,12) 11 [12,13) 15 [13,14) 19 [14,15) 23 [15,16) 26 [16,17) 28 [17,18) 31 [18,19) 35 [19,20) 38 [20,21) 43 [21,22) 43 [22,23) 44 [23,24) 45 [24,25) 49 > cummul.freq=cf[,1] > cummul.freq [1] 2 2 2 4 5 6 9 11 15 19 23 26 28 31 35 38 43 43 44 45 49 > cummul.percentile=cummul.freq/max(cummul.freq) > > cbind(frequency,relative.frequency,cummul.freq, cummul.percentile) frequency relative.frequency cummul.freq cummul.percentile [4,5) 2 0.04081633 2 0.04081633 [5,6) 0 0.00000000 2 0.04081633 [6,7) 0 0.00000000 2 0.04081633 [7,8) 2 0.04081633 4 0.08163265 [8,9) 1 0.02040816 5 0.10204082 [9,10) 1 0.02040816 6 0.12244898 [10,11) 3 0.06122449 9 0.18367347 [11,12) 2 0.04081633 11 0.22448980 [12,13) 4 0.08163265 15 0.30612245 [13,14) 4 0.08163265 19 0.38775510 [14,15) 4 0.08163265 23 0.46938776 [15,16) 3 0.06122449 26 0.53061224 [16,17) 2 0.04081633 28 0.57142857 [17,18) 3 0.06122449 31 0.63265306 [18,19) 4 0.08163265 35 0.71428571 [19,20) 3 0.06122449 38 0.77551020 [20,21) 5 0.10204082 43 0.87755102 [21,22) 0 0.00000000 43 0.87755102 [22,23) 1 0.02040816 44 0.89795918 [23,24) 1 0.02040816 45 0.91836735 [24,25) 4 0.08163265 49 1.00000000 > graph.cummul.perc =c(0, cummul.percentile) > plot(breaks, graph.cummul.perc, ylab="Relative Cumulative Frequency", main="Relative Cumulative Frequency Graph") > lines(breaks, graph.cummul.perc)> 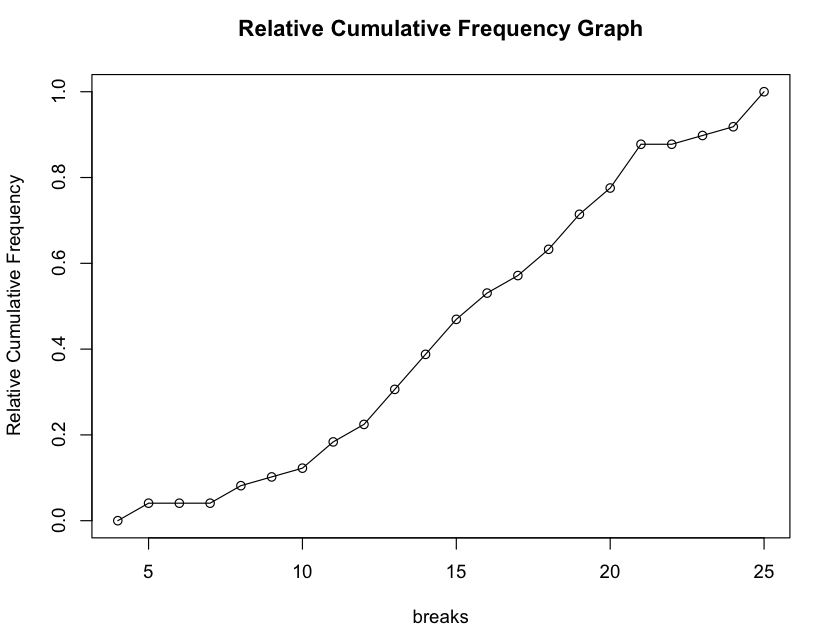 |

This work is licensed under a Creative Commons Attribution-NonCommercial-ShareAlike 3.0 Unported License.
