R: Bar and Pie Charts
>> Copy and paste the following Dataset URL into Rweb before using the code found below:
http://www.stats4stem.org/uploads/1/7/6/7/1767713/u.s._hurricane_data2011.txt
http://www.stats4stem.org/uploads/1/7/6/7/1767713/u.s._hurricane_data2011.txt
Code Only
|
Code with Rweb Output
|
|
#### EXAMPLE OF THE table FUNCTION
x=c("Yes", "No", "Yes", "Yes", "No") # Create categorical data x table(x) # table function returns the frequency for each category of data ### Now we will use storm/hurricane data # Create a table for the category of storm/hurricane cat.counts=table(cat) # Create a table for the year of the storm/hurricane year.counts=table(year) # View the respective tables cat.counts year.counts ###### CREATING BAR GRAPHS # Create a barplot of storm/hurricane categories barplot(cat.counts, col="red") # Create a barplot using percentages for the years barplot(year.counts/length(year), col="green") ###### CREATING PIE CHARTS # Basic pie chart pie(cat.counts) # Add names to your piechart names(cat.counts)=c("2005", "2006", "2007", "2008", "2009", "2010") # Pie chart with names printed out pie(cat.counts) # Now, add a little color and a main :) pie(cat.counts, col=rainbow(12), main="Atlantic Hurricanes by Year") |
> #### EXAMPLE OF THE table FUNCTION
> x=c("Yes", "No", "Yes", "Yes", "No") # Create categorical data > x [1] "Yes" "No" "Yes" "Yes" "No" > > table(x) #table function returns the frequency for each category of data x No Yes 2 3 > > ### Now we will use storm/hurricane data > # Create a table for the category of storm/hurricane > cat.counts=table(cat) > > # Create a table for the year of the storm/hurricane > year.counts=table(year) > > # View the respective tables > cat.counts cat 0 1 2 3 4 5 47 19 6 8 9 6 > > year.counts year 2005 2006 2007 2008 2009 2010 27 9 15 16 9 19 > > ###### CREATING BAR GRAPHS > > # Create a barplot of storm/hurricane categories > barplot(cat.counts, col="red") 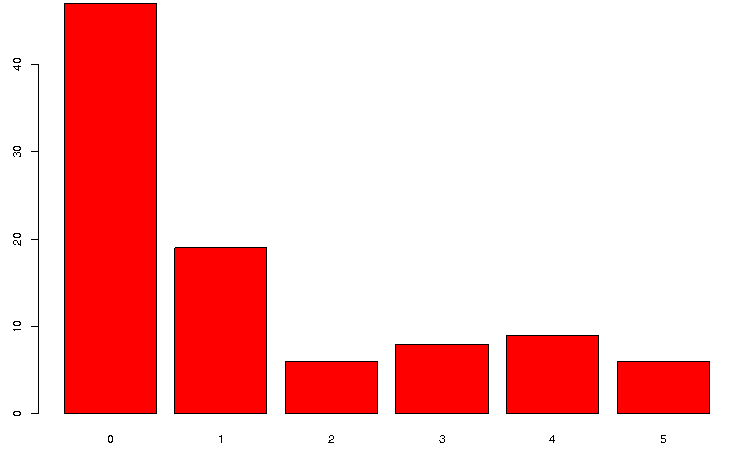 > # Create a barplot using percentages for the years
> barplot(year.counts/length(year), col="green") 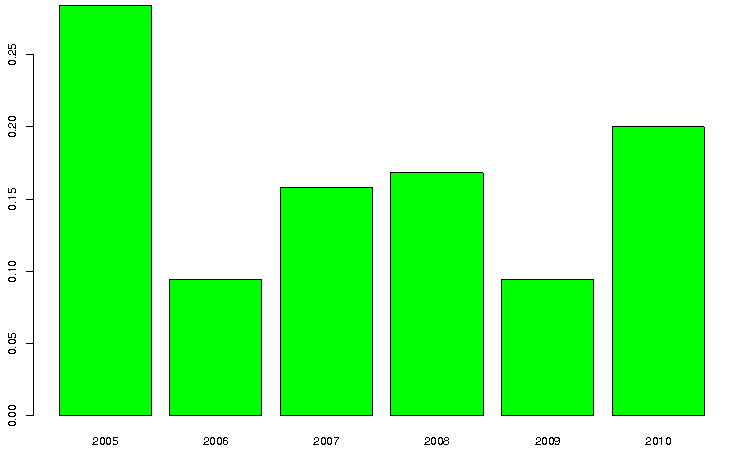 > ###### CREATING PIE CHARTS
> > # Basic pie chart > pie(cat.counts) 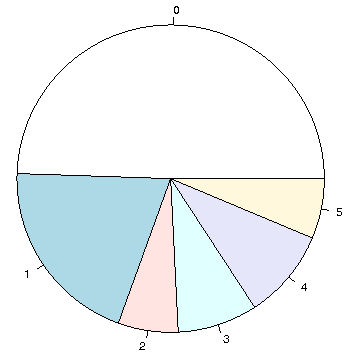 > # Add names to your piechart > names(cat.counts)=c("2005", "2006", "2007", "2008", "2009", "2010") > > # Pie chart with names printed out > pie(cat.counts) 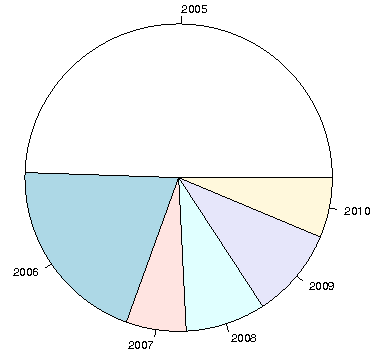 > # Now, add a little color and a main :) > pie(cat.counts, col=rainbow(12), main="Atlantic Hurricanes by Year") 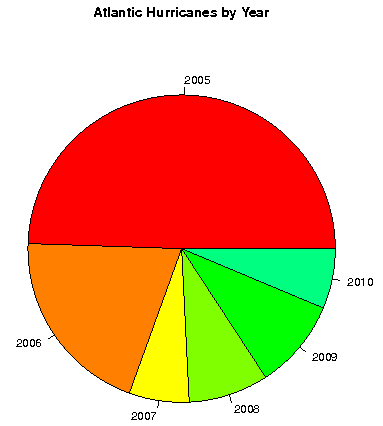 |

This work is licensed under a Creative Commons Attribution-NonCommercial-ShareAlike 3.0 Unported License.
Rweb Work Area
DATASET URL:
http://www.stats4stem.org/uploads/1/7/6/7/1767713/u.s._hurricane_data2011.txt
VARIABLES: "year" "number" "name" "wind" "pres" "cat"
http://www.stats4stem.org/uploads/1/7/6/7/1767713/u.s._hurricane_data2011.txt
VARIABLES: "year" "number" "name" "wind" "pres" "cat"
