R: Normal Distribution
Code Only
|
Code with Rweb Output
|
|
## rnorm(sample size, mean, standard deviation)
test.scores=rnorm(100, 80, 6) test.scores ## Create a histogram of test.scores hist(test.scores, prob=TRUE, col="green", main="Normal Distribution mu=80,sigma=6") x=test.scores ## define x as test.scores curve(dnorm(x, 80,6), add=T) ### Find P(x<.7) if X~N(0,1) pnorm(.7) # assume standard normal with no mean and sd pnorm(.7, 0, 1) # standard normal #### Find P(x<.7) if X~N(1,2) pnorm(.7,1,2) # normal mean 1, std 1 #### Find the z-score that corresponds to the 75th percentile qnorm(.75) #### Construct a normal probability plot to assess normality x = rnorm(100,0,1);qqnorm(x,main=X~'N(0,1)');qqline(x) #### See Normal Probability Plot x = rnorm(1000); qqnorm(x, main="Normal Quantile Plot") qqline(x, col="red") op = par(fig=c(.02,.5,.5,.98), new=TRUE) hist(x, probability=T, col="light blue", xlab="", ylab="", main="", axes=F) lines(density(x), col="red", lwd=2) ## Source code: http://zoonek2.free.fr/UNIX/48_R/03.html #### See Normal Probability Plot - Geometric Distribution x = rgeom(1000, 0.2); qqnorm(x, main="Normal Quantile Plot") qqline(x, col="red") op = par(fig=c(.02,.5,.5,.98), new=TRUE) hist(x, probability=T, col="light blue", xlab="", ylab="", main="", axes=F) lines(density(x), col="red", lwd=2) ## Source code: http://zoonek2.free.fr/UNIX/48_R/03.html |
> ## rnorm(sample size, mean, standard deviation)
> test.scores=rnorm(100, 80, 6) > test.scores [1] 77.17300 86.60134 80.93126 74.53019 83.31789 76.16808 ... > > ## Create a histogram of test.scores > hist(test.scores, + prob=TRUE, + col="green", + main="Normal Distribution mu=80,sigma=6") 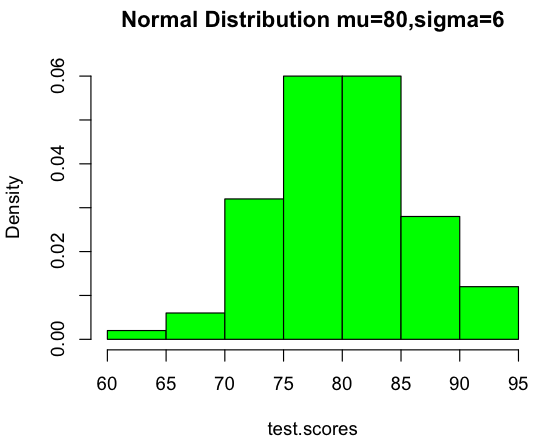 > x=test.scores > curve(dnorm(x, 80,6), lty=1, add=T) 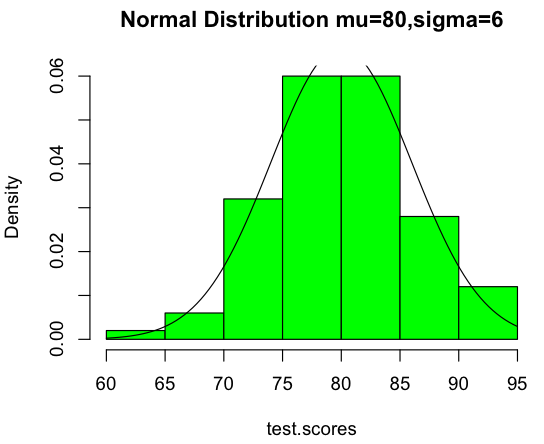 > ### Find P(x<.7) if X~N(0,1) > pnorm(.7) # assume standard normal with no mean and sd [1] 0.7580363 > pnorm(.7, 0, 1) # standard normal [1] 0.7580363 > > #### Find P(x<.7) if X~N(1,2) > pnorm(.7,1,2) # normal mean 1, std 1[1] 0.4403823 [1] 0.4403823 > > #### Find the z-score that corresponds to the 75th percentile > qnorm(.75) [1] 0.6744898 > > x = rnorm(100,0,1);qqnorm(x,main=X~'N(0,1)');qqline(x) 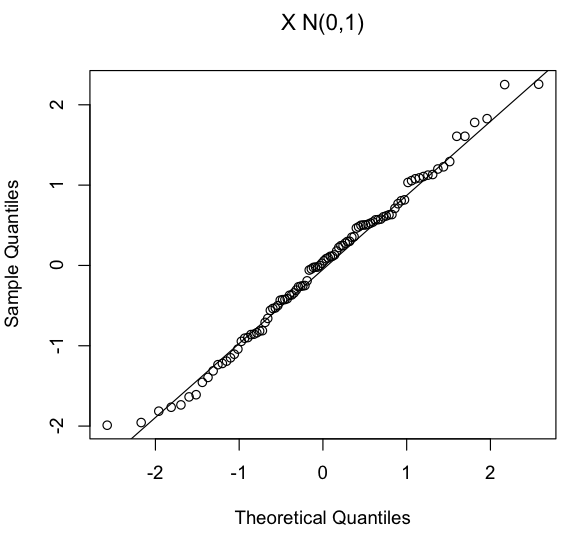 #### See Normal Probability Plot x = rnorm(1000); qqnorm(x, main="Normal Quantile Plot") qqline(x, col="red") op = par(fig=c(.02,.5,.5,.98), new=TRUE) hist(x, probability=T, col="light blue", xlab="", ylab="", main="", axes=F) lines(density(x), col="red", lwd=2) ## Source code: http://zoonek2.free.fr/UNIX/48_R/03.html 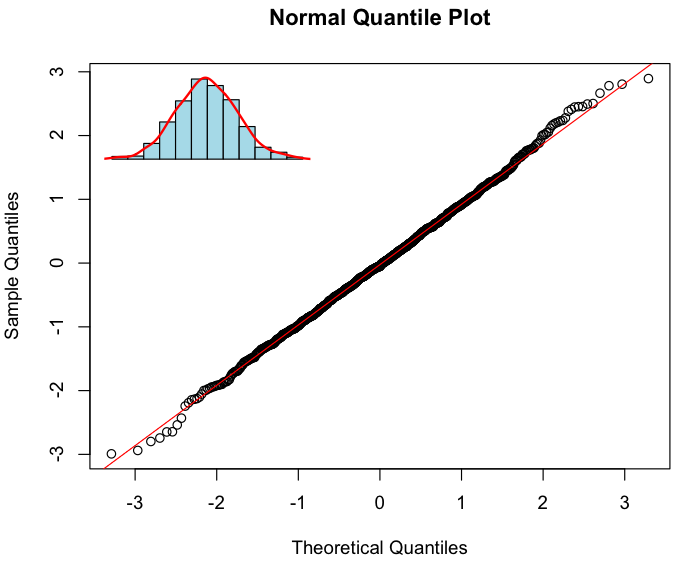 #### See Normal Probability Plot - Geometric Distribution x = rgeom(1000, 0.2); qqnorm(x, main="Normal Quantile Plot") qqline(x, col="red") op = par(fig=c(.02,.5,.5,.98), new=TRUE) hist(x, probability=T, col="light blue", xlab="", ylab="", main="", axes=F) lines(density(x), col="red", lwd=2) ## Source code: http://zoonek2.free.fr/UNIX/48_R/03.html 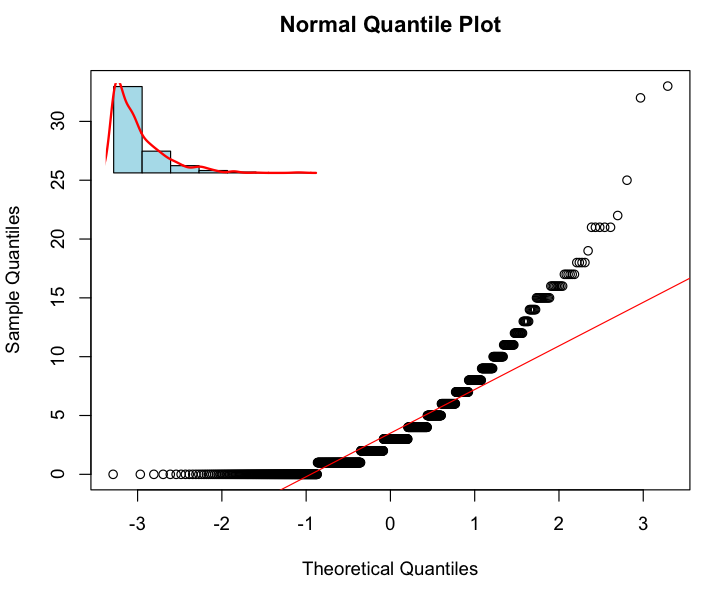 |

This work is licensed under a Creative Commons Attribution-NonCommercial-ShareAlike 3.0 Unported License.
